
Taking on data analysis of sustainability research
The final evaluation of the Transformations to Sustainability programme was carried out by the Division for Social Sciences and Humanities at the Research Council of Finland. The interdisciplinary nature and societal impact of research were central themes in the evaluation. The Division trainees were responsible for compiling a summary of the reported data.
The Research Council of Finland belongs to the NORFACE network (New opportunities for Research funding Agency Cooperation in Europe) that funds social sciences research. The aim of the network is to develop financial cooperation between research organisations that fund social sciences. NORFACE promotes cooperation in research funding through exchange of information, analysis, joint workshops, and research programmes.
NORFACE and the Belmont Forum, which funds global sustainability research, funded the transformation to sustainability (T2S) programme in 2018–2022. One of the twelve projects (CONVIVA - the convivial Conservation Research project) also involved a Finnish research group.
The special role of the Division of Social Sciences and Humanities in the T2S programme was to organise its final evaluation in collaboration with colleagues from the Economic and Social Research Council (ESRC). In the interim and final reports of the twelve research projects funded by the programme, the researchers described a wide variety of different research outputs and results.
The most important task for the Division trainees was to transform the content of the final reports of the programme’s research projects into an accessible summary.
Examining stakeholder cooperation in research projects
One of the funding criteria for the T2S programme was societal impact, the implementation of which was monitored by requesting the projects to report on how they handle stakeholder cooperation.
The material presenting societal interaction formed over a hundred different output categories that were studied, combined and divided into sub-categories. This resulted in forty subcategories divided into four larger groups: interaction events and presentations; written non-academic publications; media appearances; and other activities, such as visual art outputs. This allowed us to classify the stakeholder activities of research projects into sufficiently comprehensive and easily understandable categories. The division was also used to produce informative and illustrative infographics for the review panel members’ data packages and final report. The infographics provided both accurate figures and a wider view of stakeholder cooperation.
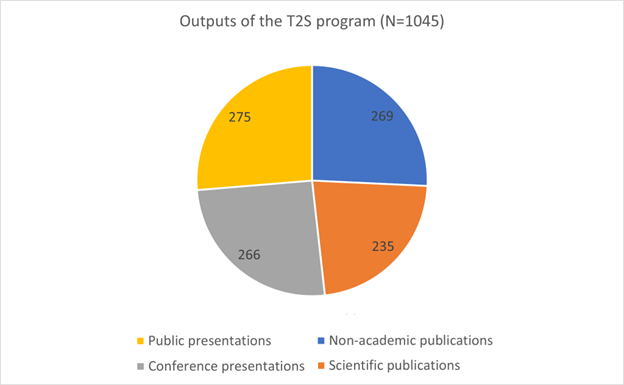
Figure 1. Scientific publications, non-academic publications, conference presentations and public presentations in the results of the T2S programme.
Interdisciplinarity and societal impact as central themes
The infographics of the final report were based on the cross-cutting objectives of the T2S programme for its projects: interdisciplinarity and societal impact. We studied the data to determine what the projects were doing to achieve these objectives. Which field were the recruited researchers and staff from? Which research methodologies were used?
The above was combined with social interaction: how and with whom the research projects collaborated? Who were the people impacted by the results and how were they taken into account? This allowed us to record the main results of each project based on the programme's objectives. For example, two thirds of the projects aimed to influence policy at either national or international level. Much of this policy influencing consisted of training decision-makers.
Observations from the final evaluation data: imbalance between the global North and South
An illustrative example of what the compilation of the final evaluation data comprised is the analysis of the roles of the research projects’ members. One of the most interesting results of the analysis proved to be that examining the sites of research of people in research roles did not by itself give a sufficiently accurate view of the imbalance between the global North and the global South at programme level.
We received feedback from the researchers explaining that although the programme's research staff was quite evenly distributed between the global North and the South, there was a clear overrepresentation of the global North in the management positions of research projects. The diagram below shows how the same data can be interpreted in two completely different ways depending on how the data are presented.
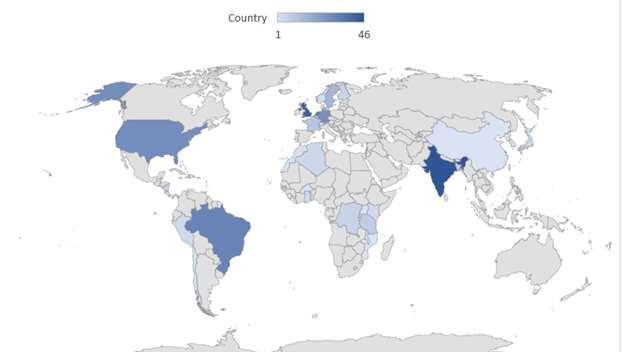
Figure 2. The geographical distribution of T2S researchers.
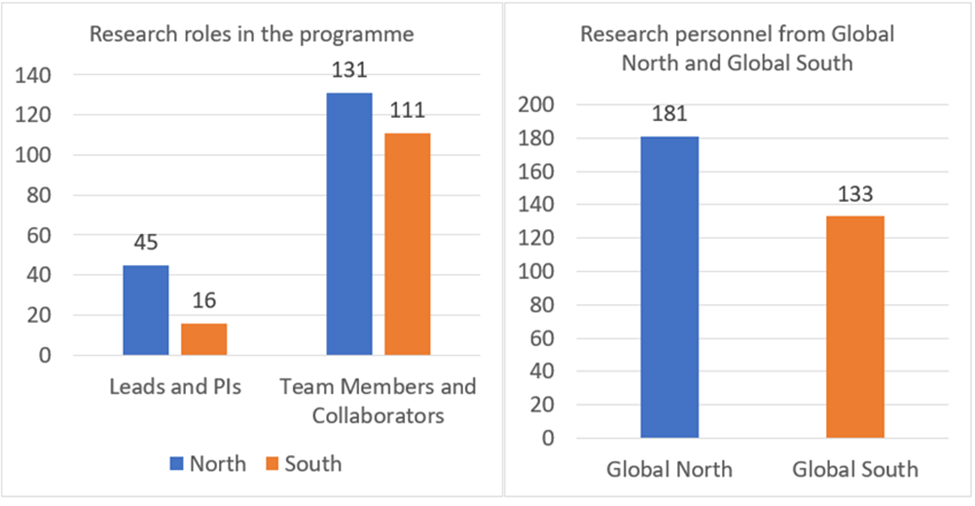
Figure 3. The global distribution of sites of research for T2S researchers. Number of people on the left and above the bars.
Varied reporting styles posed a challenge
One of the main challenges in the data analysis was the varied reporting styles among research projects: some described their achievements in considerable detail, while others listed them very briefly. In other words, we had to interpret the material, find further information, and present each project fairly despite the differences in the reports, which was one of our most demanding tasks.
Another major challenge was to work independently within a strict time limit as part of the team that carried out the data analysis. We were pressed for time due to extensions granted to projects during the Covid-19 pandemic, which postponed their final reports. We had to choose fast, and many interesting, but inessential pieces of data were analysed less closely.
Diving into international reporting templates and data produced by different administrative systems was a source of both joy and frustration. The greatest joy, however, were the praises the international review panel gave for our work: the trainees had contributed to the implementation of a high-quality review process.
The Division for Social Sciences and Humanities trainees had different tasks in the data analysis. Katariina Flinck focused on non-academic publications and stakeholder activities, whereas Juhokalle Pekkala focused on the scientific publications and the makeup of the research projects’ staff.
The trainees’ main tasks were analysing and presenting raw data visually as well as writing background texts. We compiled summaries of the funded research projects and produced graphs and figures from a wide range of data which review panel members used to assess the results and outputs of the programme.
The data formed an image of a multifaceted programme, whose interdisciplinarity and societal interaction impressed the review panel.
A total of 22 different infographics were compiled from the Excel data, such as the numbers and channels of scientific publications and public presentations. Based on our work, the review panel members quickly obtained a comprehensive and accurate view on project staff, stakeholder cooperation, and scientific and other outputs. Based on feedback from the panel, the material package was invaluable to their work. Additionally, the T2S steering group appreciated the compilation so much that the graphs produced by the trainees were included in the final evaluation report sent to the EU Commission.
Read more:
The Research Council of Finland has been a member of the NORFACE network since its establishment in 2006. The Research Council’s person in charge of presenting the RC in the network is Science Adviser Suvi Kansikas from the Division for Social Sciences and Humanities.